I Co-Wrote a Book!! Data Sketches is released
Sharing my latest personal & client projects, art collections, blogs, and more
Lots of new updates! I co-wrote a book (!), stopped working to go back to studying at the Fab Academy for 6 months, created my biggest data art piece ever, and more!
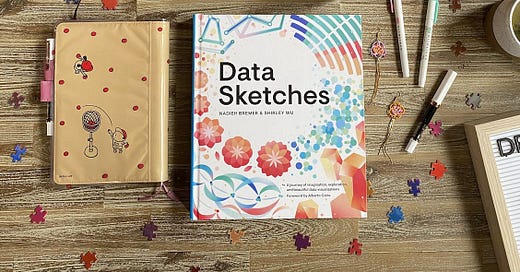
Data Sketches | The Book
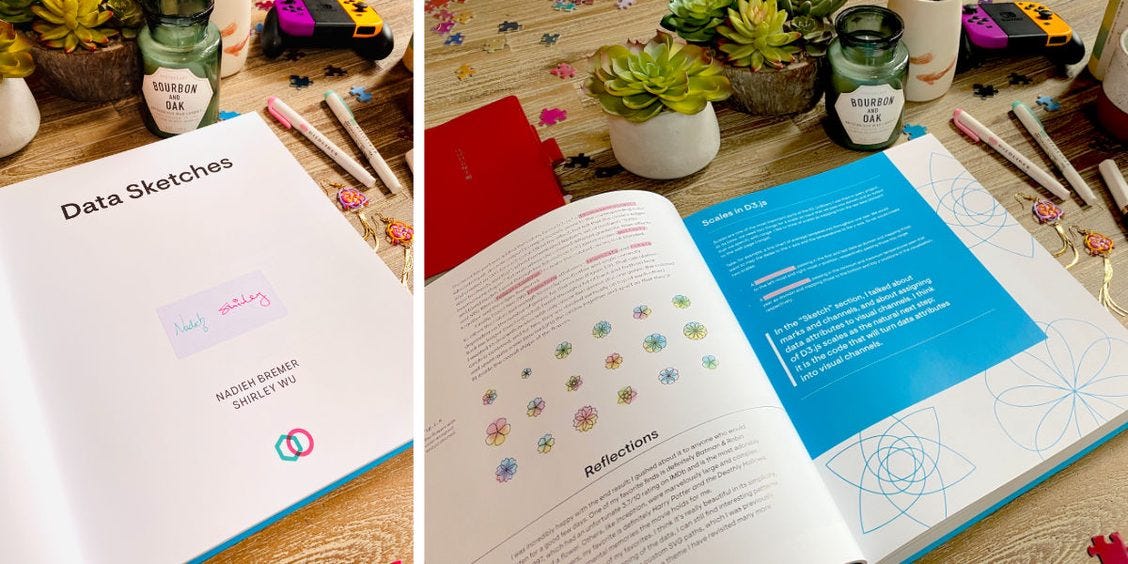
It finally happened! (ノ◕ヮ◕)ノ*:・゚✧ The book following the Data Sketches project that my collaborator Shirley Wu and I worked on since 2016 came out last February!
Ever since Shirley and I started Data Sketches, we've dreamed of creating a beautiful coffee table book with large, indulgent images of our projects, side-by-side with our technical process write-ups, and it’s finally here!
We’re extremely proud of the (giant, literally!) book, both in terms of the content and how it looks, having worked closely with amazing artist Alice Lee for the gorgeous cover and agency Praline to really lift the internal design to the next level.
There’s a 20% sale going on at our publisher Routledge right now, and there might even be a few last signed copies available (^▽^) You can order a signed copy by filling in this form (using the code SS120 you’ll also get a 20% discount!)
Go to the Website
How to Make Almost Anything | Fab Academy
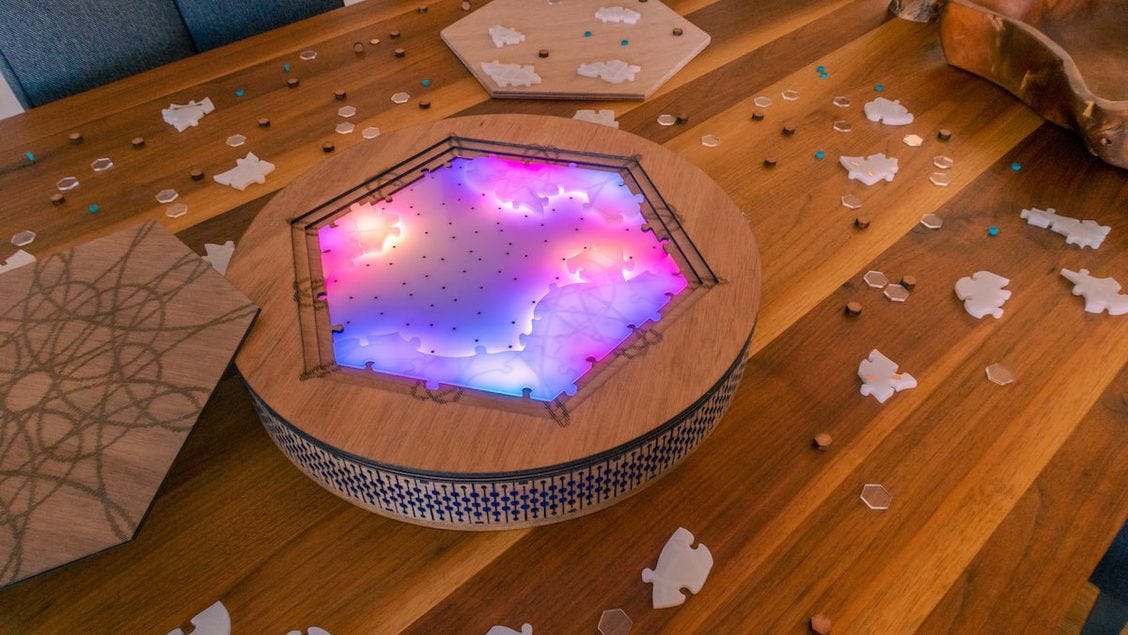
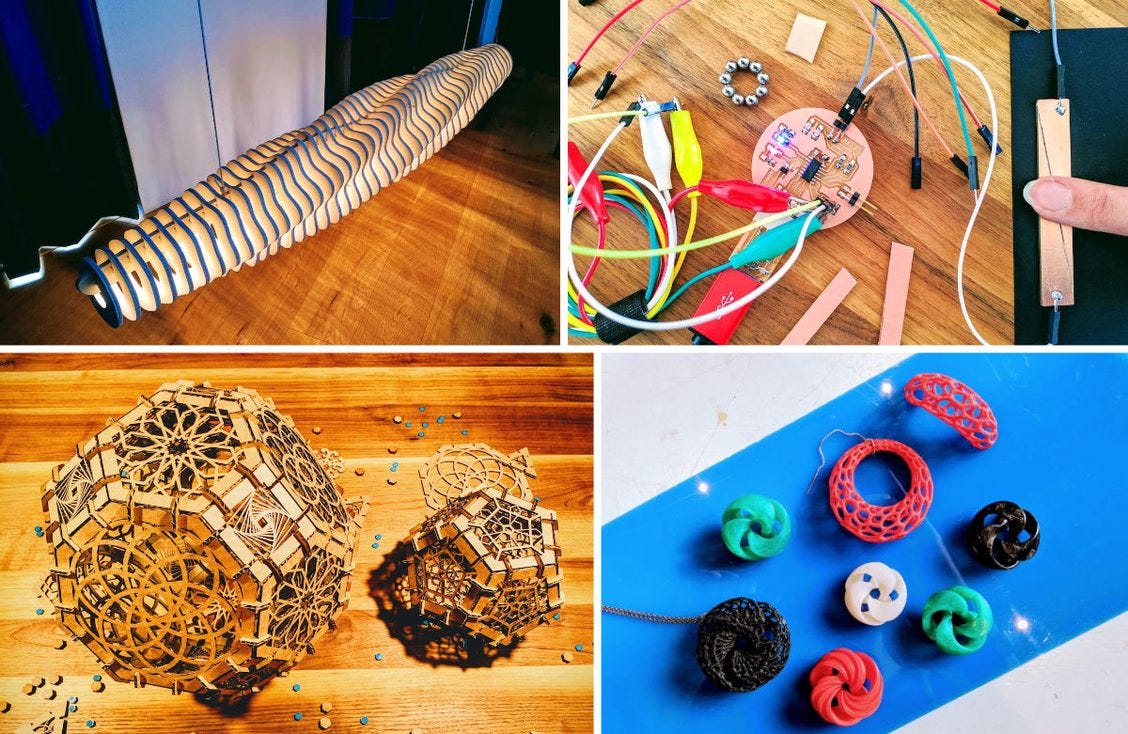
I stopped working for the first half of 2021 to study at the Fab Academy, also known as the course on ‘How to Make (almost) Anything,’ a 20-week full-time course during which you learn how to become a maker. I learned how to design for, and create with, laser cutters, 3D printers, and milling machines, make my own electronics, and more. For my final project, I made a jigsaw puzzle that incorporates light effects underneath the pieces, and whenever a new piece is placed on the board (♥‿♥)
If you’d like to know what else I made, I created a dedicated website with giant write-ups on what I learned, what machines I used, and what weekly project I made; from Archimedean Solids made from cardboard, a 3D-printed jewelry collection, a big wooden curved ceiling light, and much more.
I also wrote a (shorter) blog post that summarizes what you learn each week and what I created, explaining how a typical week looks, in case you might be interested in Fab Academy.
Check out the Blog
A Year of Electrical Grid Data | Swissgrid
The biggest piece of data art that I’ve ever created, literally!
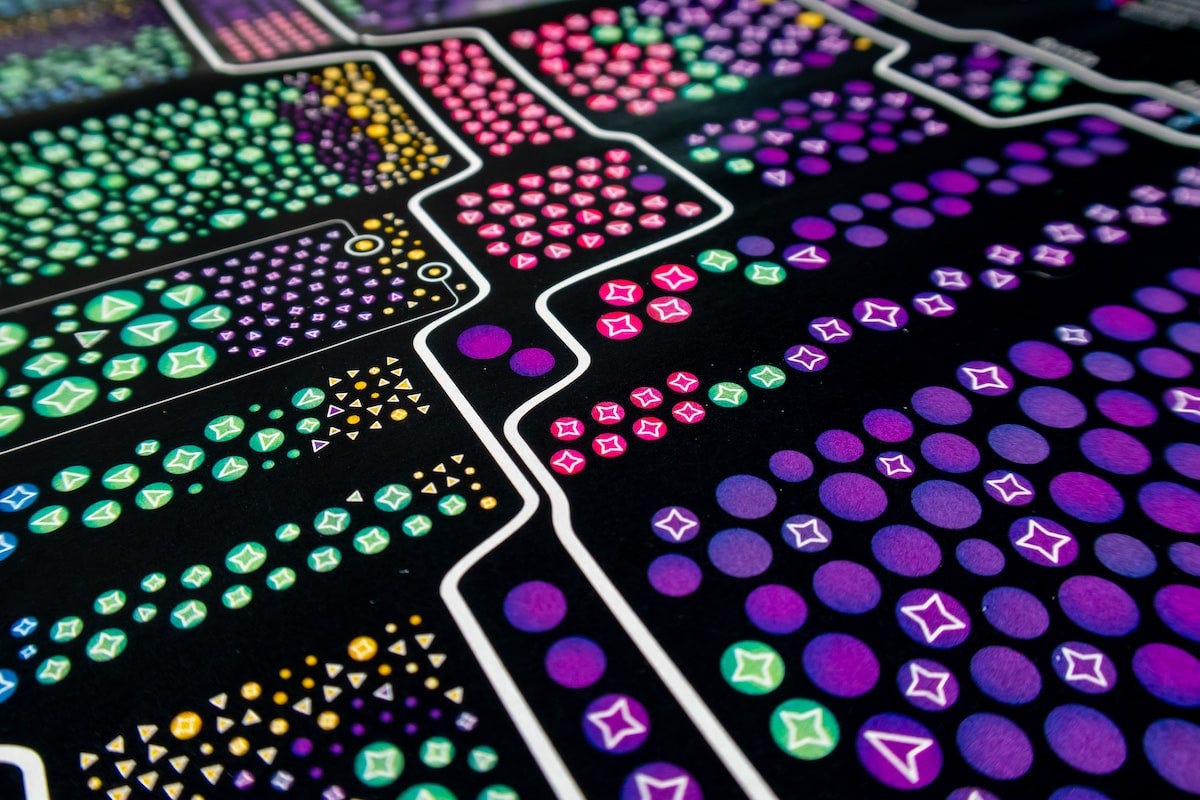
Swissgrid, the national transmission system operator in Switzerland, reached out to me because they wanted to explore an artistic way to visualize the data that is generated in their extra-high-voltage network of electrical grids. With over 60 million data points from the year 2019, it was quite a challenge to find the right balance of aggregating values while still showing as much detail as possible.
The final result, called “Landscape of Power Flows,” became a giant work of 2m x 2.7m, printed on acrylic glass, and is now hanging in the lobby of Swissgrid’s main office in Aarau.
You can see more images of the piece up close in my portfolio, and read a little about its creation here.
Space Wars | Scientific American
I can never get enough of working on space and astronomy-related data visualizations! I was, therefore really happy that I got to work on this piece for the ‘Space Wars’ article in Scientific American, revealing as much as I could about all the active satellites in space. Adding details about satellite size to function, the country that owns it, which orbit, what class (defense, commercial, …), and more.
Check out the Visual
Interview | Designing Data Visualizations
Oliver Lindberg interviewed me for Shaping Design. One of my favorite interviews, possibly my favorite one, because it packs in so many different aspects without getting too long. This piece reveals all the tools I use, my general workflow, and how I switched from astronomy to dataviz in the first place, with a short intro going into one of my favorite projects, visualizing all of Hubble’s observations.
Read the Full Interview
Shop | DataViz Prints & Generative Pen Plots
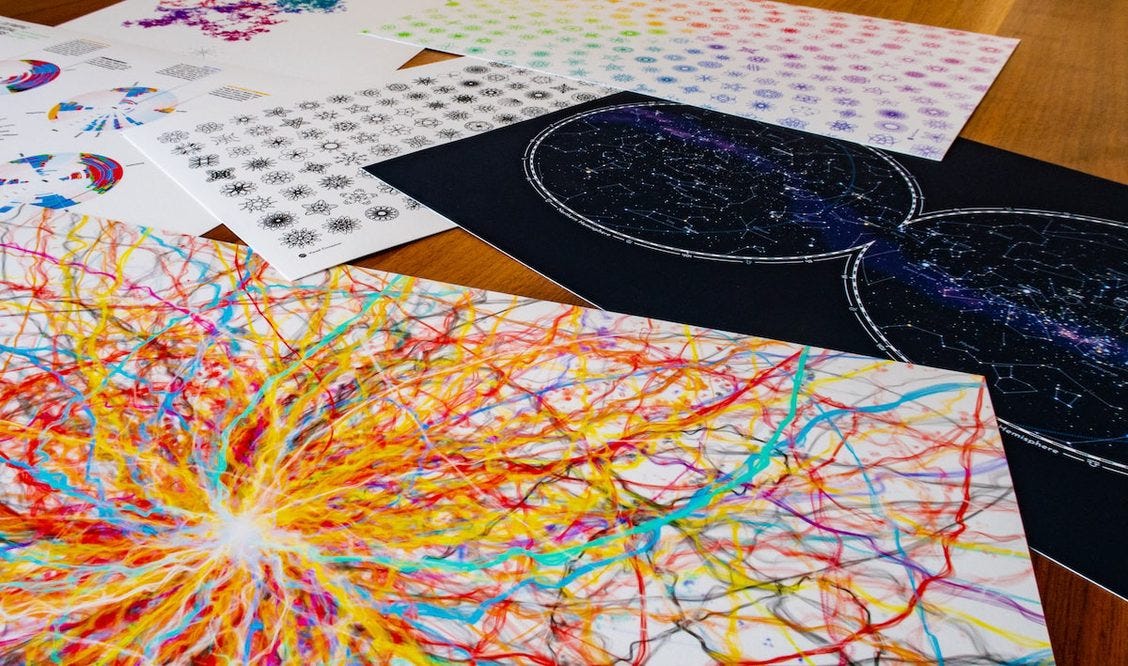
Just a reminder that you can find data visualization prints of several of my projects in my online shop. From spirographs, sky maps, visualizing pi, and more. The giclee posters are printed on lovely thick, textured archival paper with vibrant inks that don’t fade.
There’s free worldwide shipping on all posters, while you’ll get a few goodies in the envelope if you choose a pen plot instead.


