

Fictional Space Maps, Exploring our Inner Mind, MCM art, and Maps of Switzerland
Sharing my latest personal & client projects, art collections, blogs, and more

I somehow ended up doing a lot of data and generative art over the past few months, from creating fictional star maps for Axiom Space, exploring our inner mind for my “Fleeting Thoughts” collection, and going for some Mid-Century Modern inspiration with “wavʌves” that opened just now.
But there’s also dataviz! I created two elaborate animations about the rise of solar panels in Switzerland.
BTW, I switched to Substack for my newsletters! Fingers crossed this process has gone smoothly…


wavʌves | N=12 | Feral File
As part of the N=12 group exhibition with 11 other amazing artist on Feral File, I created “wavʌves” (pronounced waves), which opened up today! It goes back to some of my favorite style elements; embracing the flatness of shapes, with a slight sense of unperfection, while including a vibrant color palette. All in the style of some Mid-Century Modern art, which I’ve really come to love over the past few months while looking into interior design (we’ve just moved!).
Check out wavʌves
Fleeting Thoughts | Flatlands | Alba
At the end of June “Fleeting Thoughts” was released as part of the Flatlands exhibition on Alba.art. Wanting to start out by “creating chunky shapes that roughly follow a certain path”, it evolved into a collection that, to me, represents the workings of our inner mind. Again embracing the “perfect flatness” of the digital realm, combined with vibrant color palettes.
See the Collection of 100 Pieces
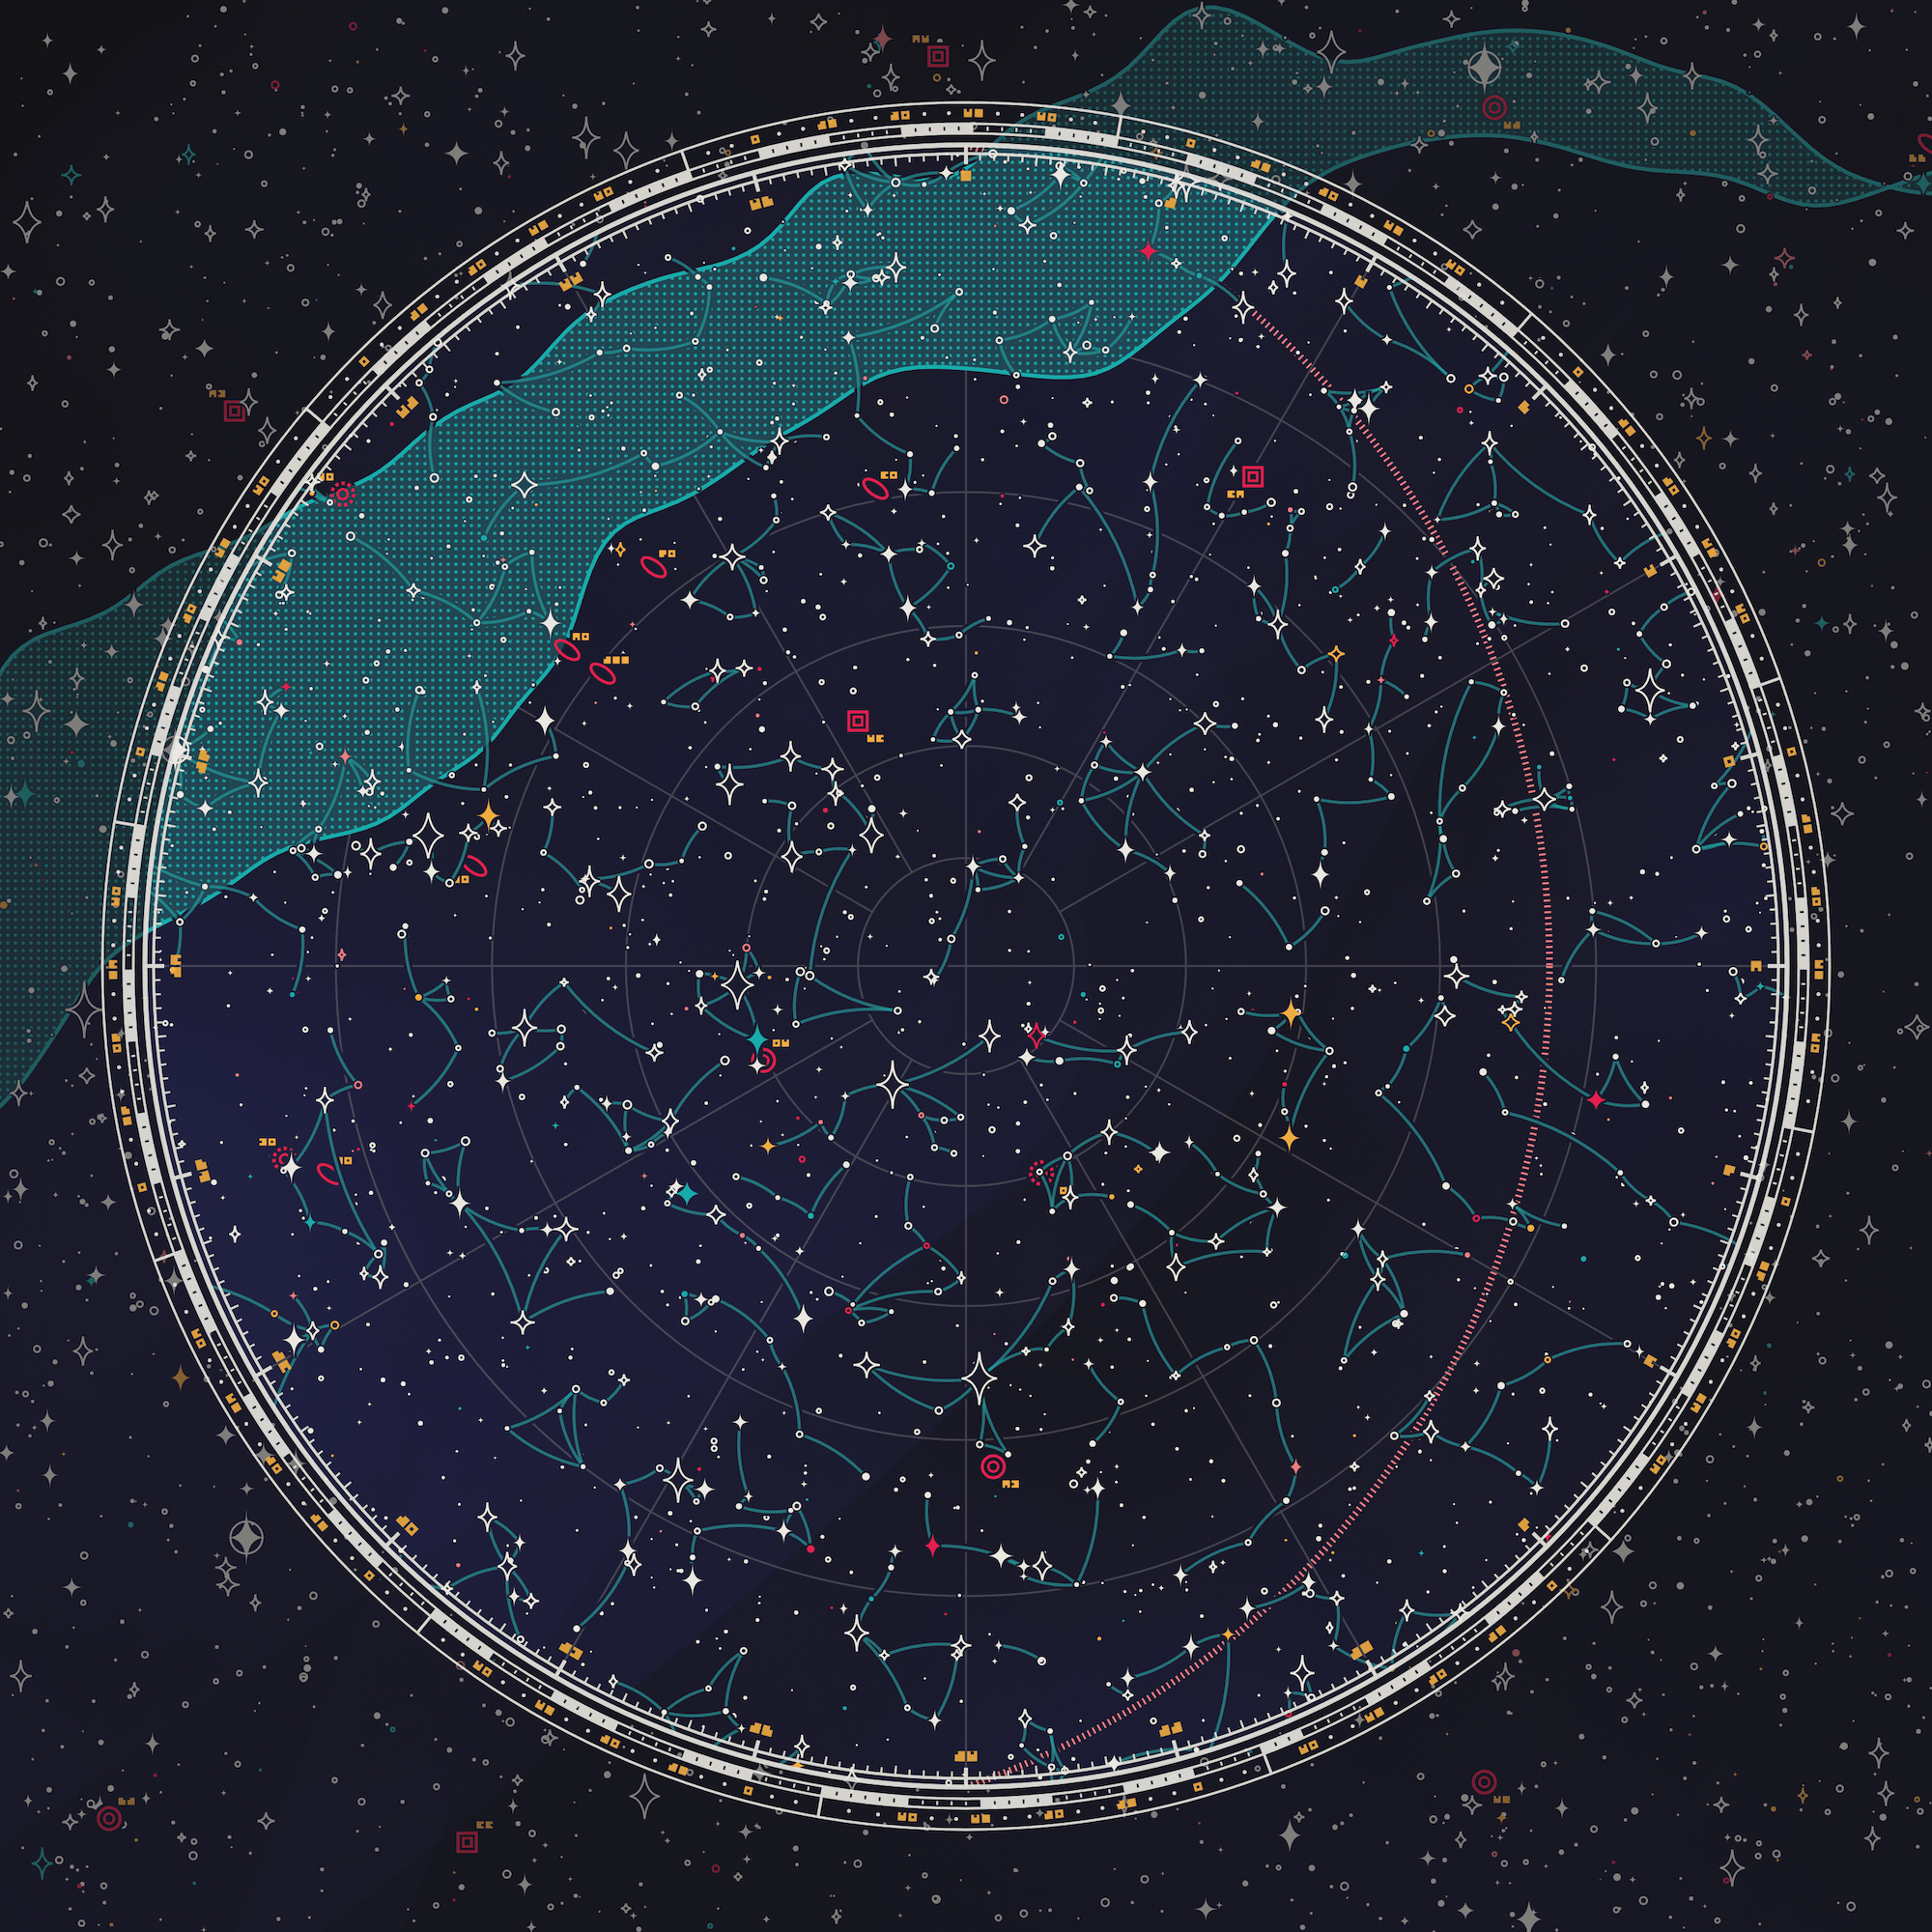
Imagine | Axiom Space
To celebrate the Ax-2 mission to the ISS this past May, I created “Imagine” a collection of fictional star maps that transport viewers to worlds yet to be discovered. Each map is completely unique and has dozens of constellations waiting to be named.
See More from “Imagine”

GenCoop | Swissgrid
I created two elaborate animations for Swissgrid about solar panels; One shows the immense rise of solar panels over the past 35 years since the first was registered in 1988. While the second one reveals a model of the expected daily energy production of each panel across 2022 using local weather data. I incorporated the “contour line” design throughout the visual and animations, hopefully turning this into something the audience would remember :)
Check out the Project
And that was it again for now! I’m just starting on a big dataviz project for an exciting client that I hope to show you some WIP from in the coming month (on Twitter probably). But I will also have to balance the coming weeks (months?) with the immense house renovations that just got started last week, wish me luck… (I had no idea you could overwork the joints in your fingers(?!), from all the lifting and cleaning o.O)