

A Data Art Collection About the Foods We Eat, Voronoi Treemaps about Health and Death and more...
Sharing my latest personal & client projects, art collections, blogs, and more

I got to work on another Data Art collection again! This time visualizing the foods we eat. But I also created nine charts for the European Union, wrote a new blog and have some updates to share about my new book CHART!
A Data Art Collection About the Foods We Eat | Intake
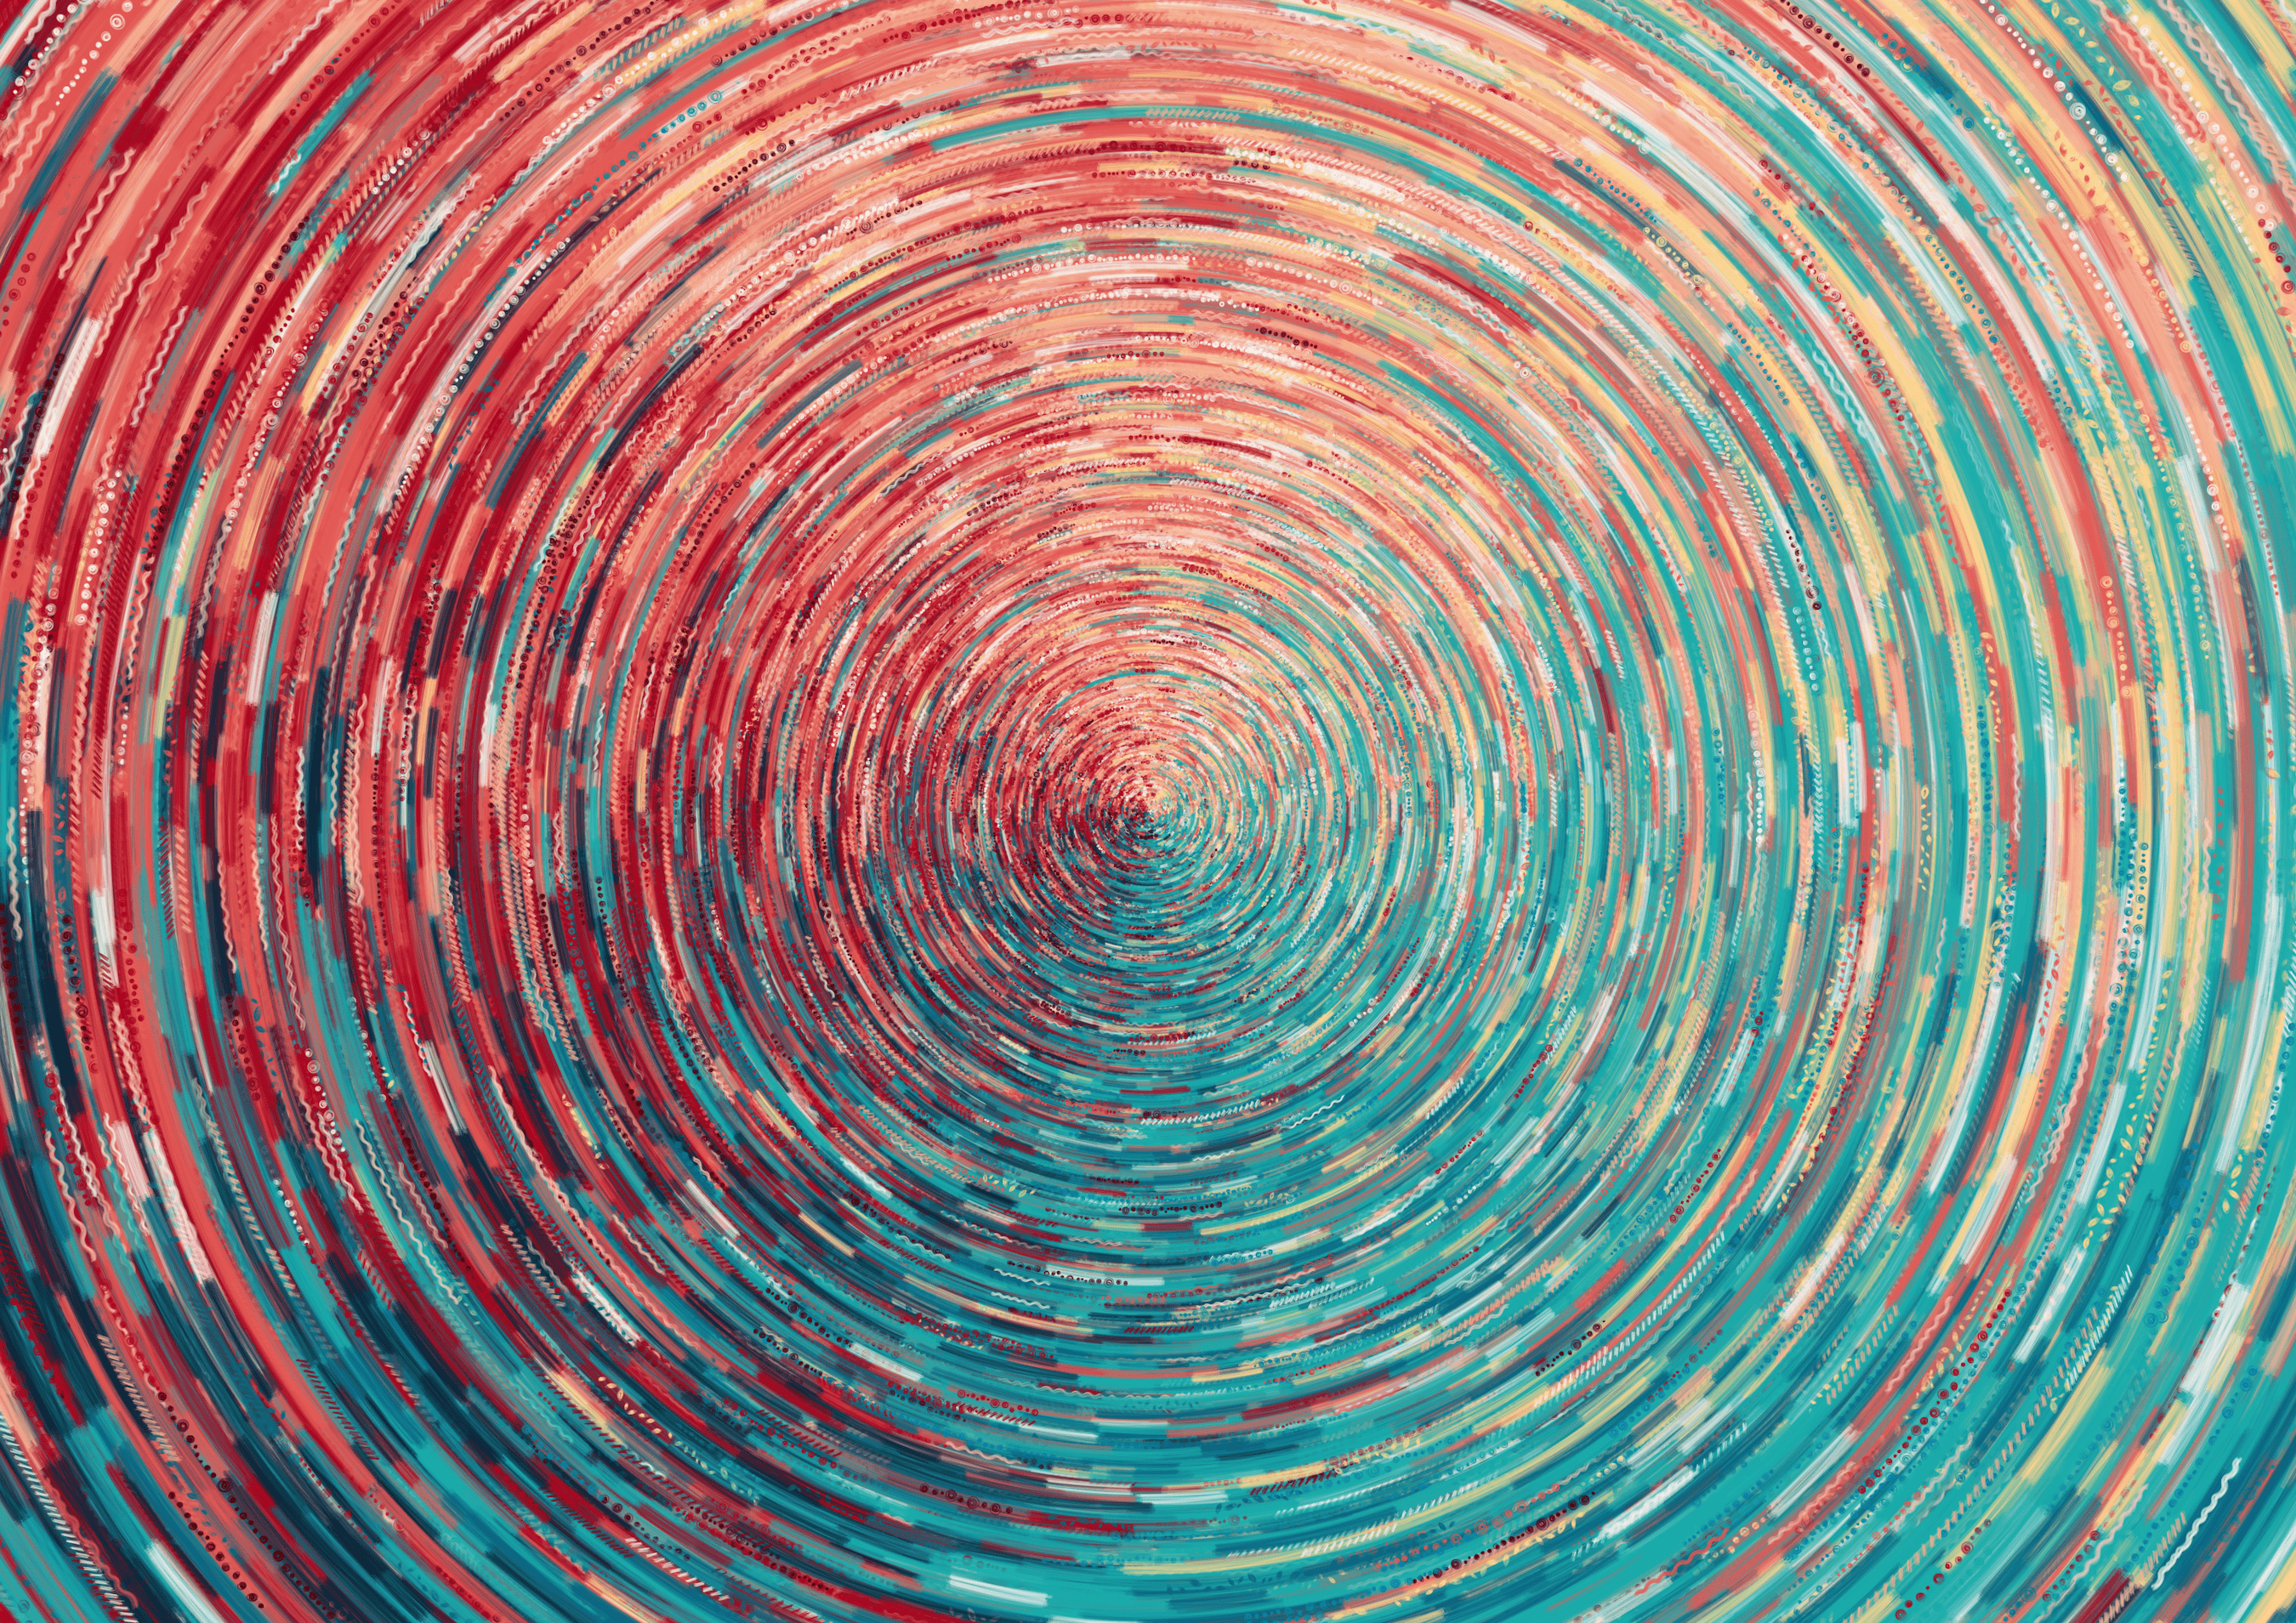
I got to create a six-piece data art collection for the GDQS Country Story Book by Intake, turning their “Global Diet Quality Score” data (the ingredients that a person eats in a day) from over 80,000 people across 23 countries into colorful data artworks. Each artwork translates their 25 GDQS food/ingredient groups into distinct visual motifs, such as wavy white lines for the Whole Grains group or bold red circles for Red Meat, weaving data and design into a portrait of how the world eats.
The centerpiece shows what a single person ate in a day as a vibrant ring. Stacking thousands of such rings together reflects the variety and amount of foods people from all over the world have eaten in a single day. The resulting circular form evokes the familiar image of a plate of food as seen from above.
The other five artworks dive into themes like animal-source foods, fruits, and sweets, drawing on familiar shapes like lollipops and fruit slices. Together, the series celebrates the beauty, diversity, and culture behind global diets.
See All the Artworks Here


Data Stories | Publications Office of the European Union
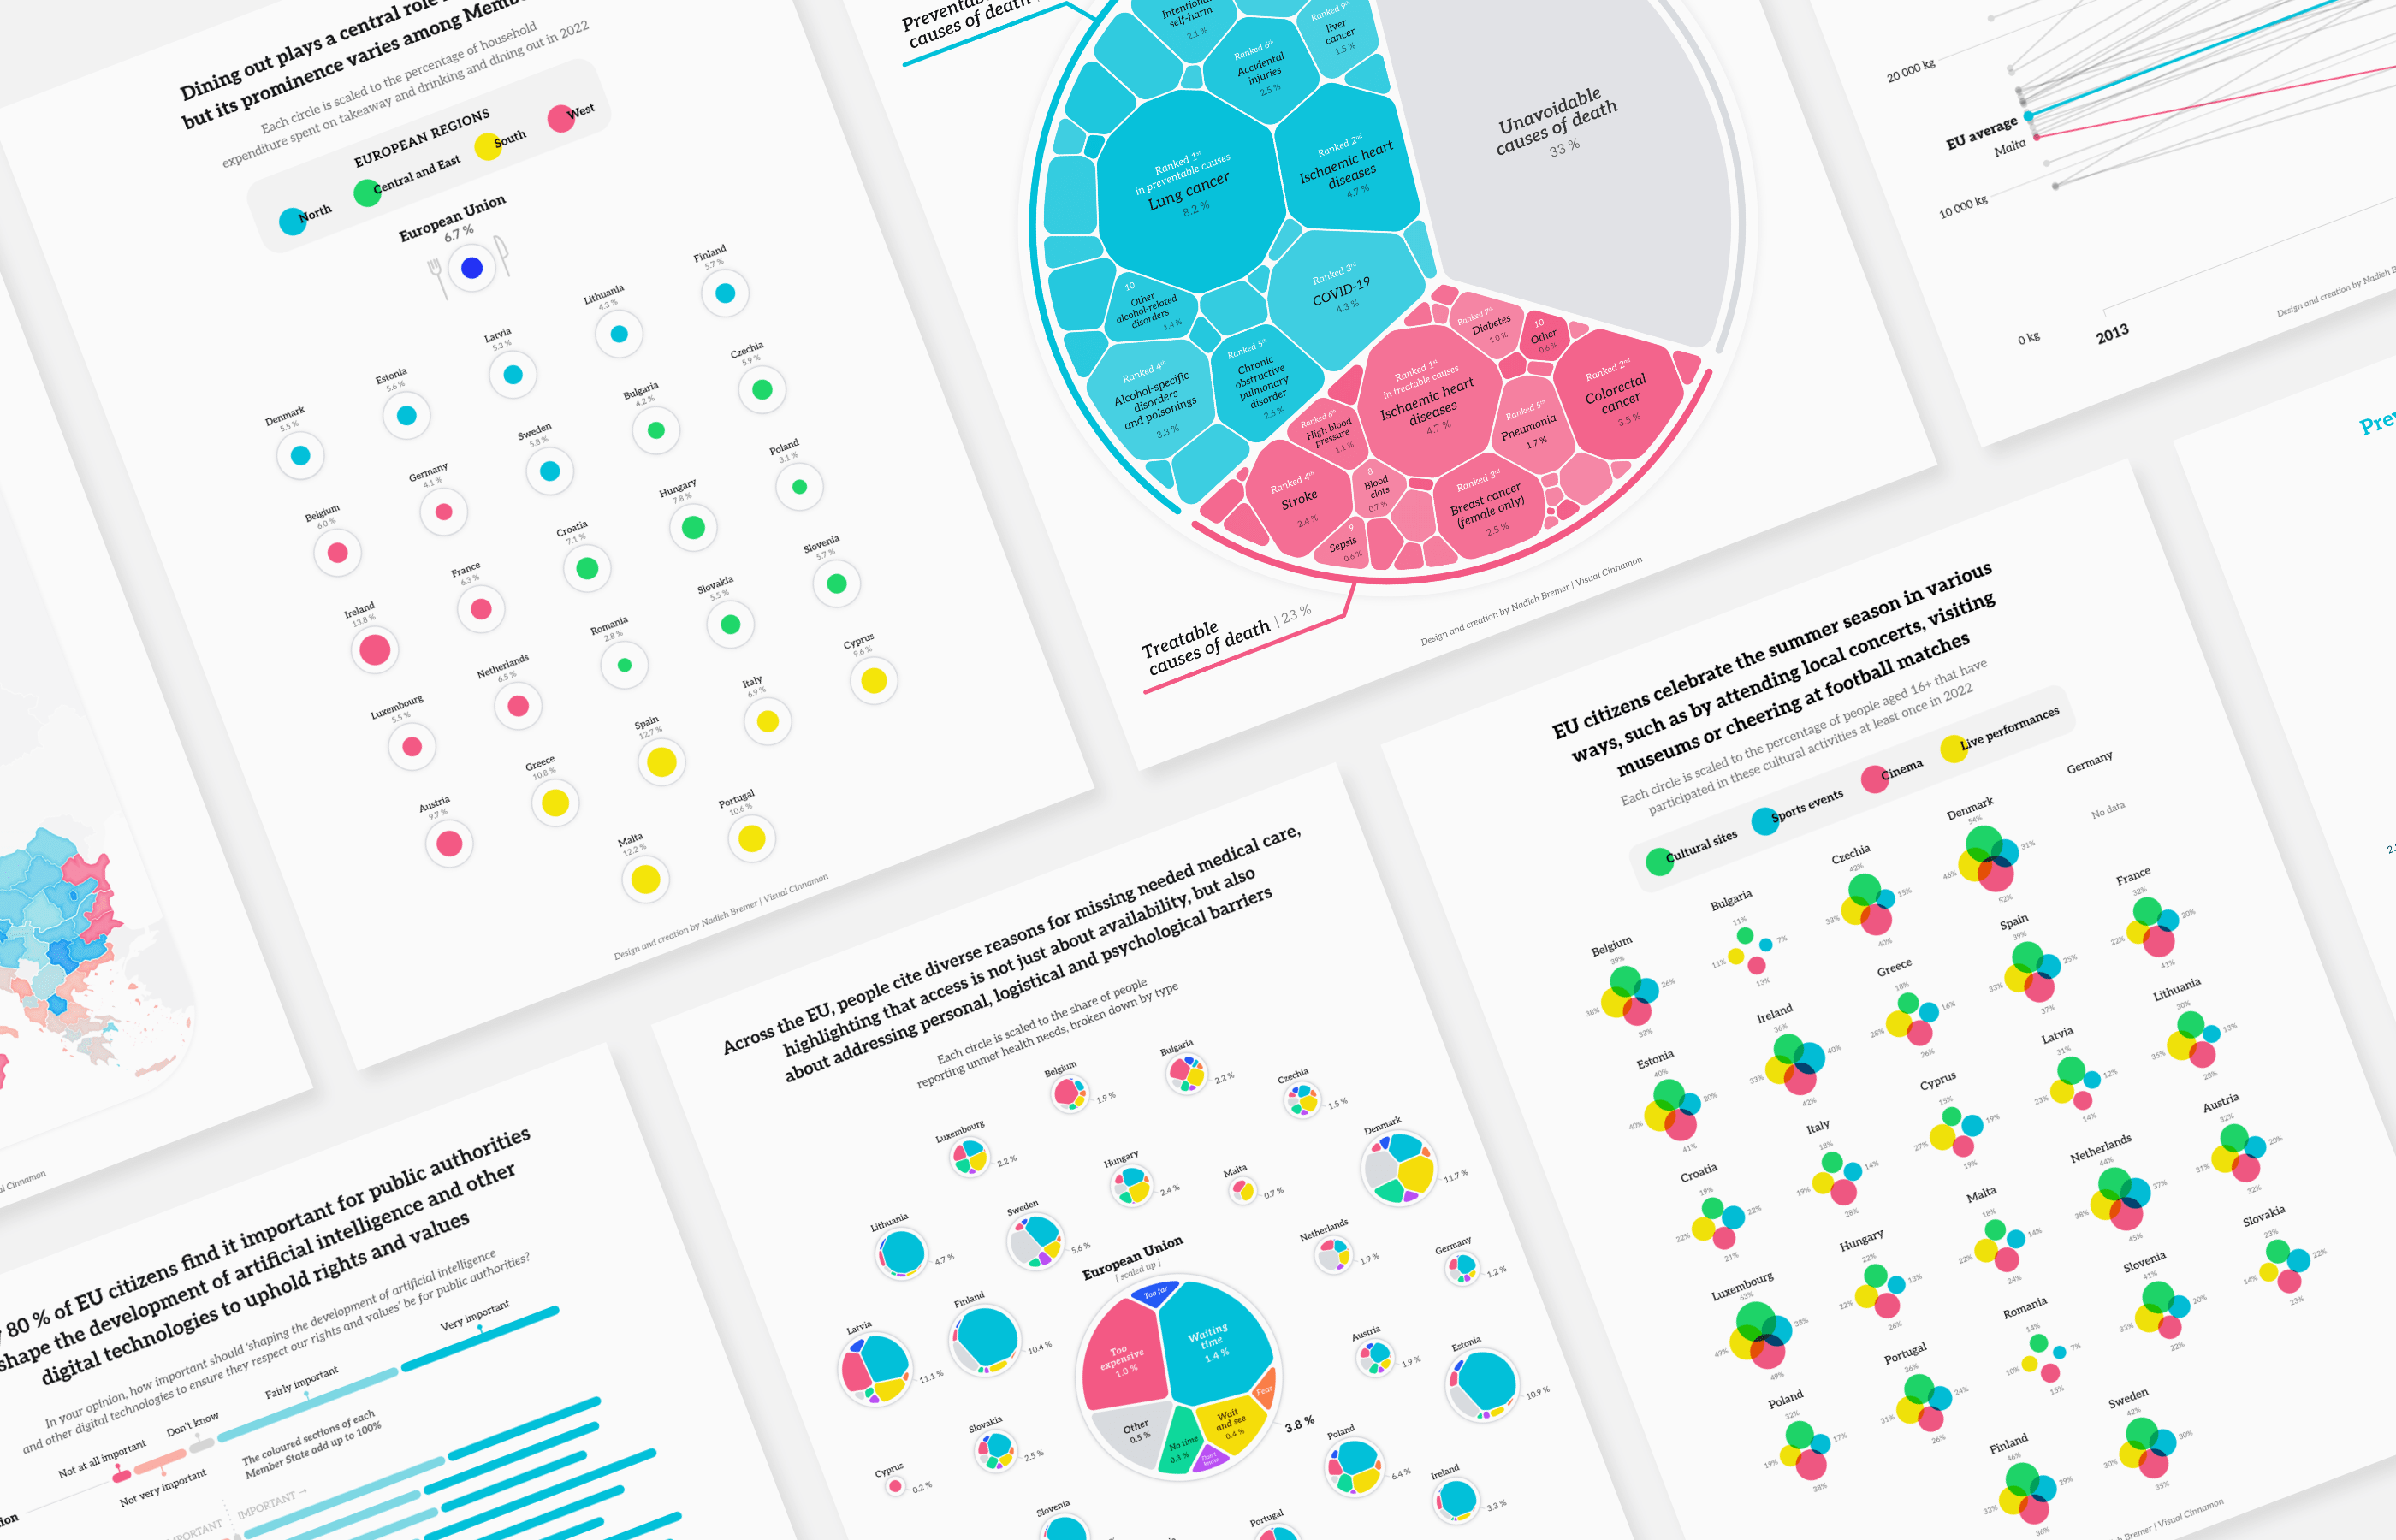
The Publications Office of the European Union invited me to design data visualizations for three of their monthly Data Stories, each exploring a different theme through the EU’s open data.
The first story, A Promising Horizon, looks ahead to the 2025–2027 Horizon Europe strategic plan and its investments in areas like the circular economy, space, and AI. The second, Leisure in Europe, takes a lighter tone, revealing how people across the EU spend their free time, from dining out to cultural activities. The third, Health and Well-being in the EU, focuses on prevention, disease burden, and access to care.
Although the brief mentioned that straightforward charts were more then fine, I tried to make sure that each looked visually appealing and memorable, including one of my favorite lesser-used chart forms like Voronoi treemaps.
Check Out All Nine Charts Here

CHART | More Updates!
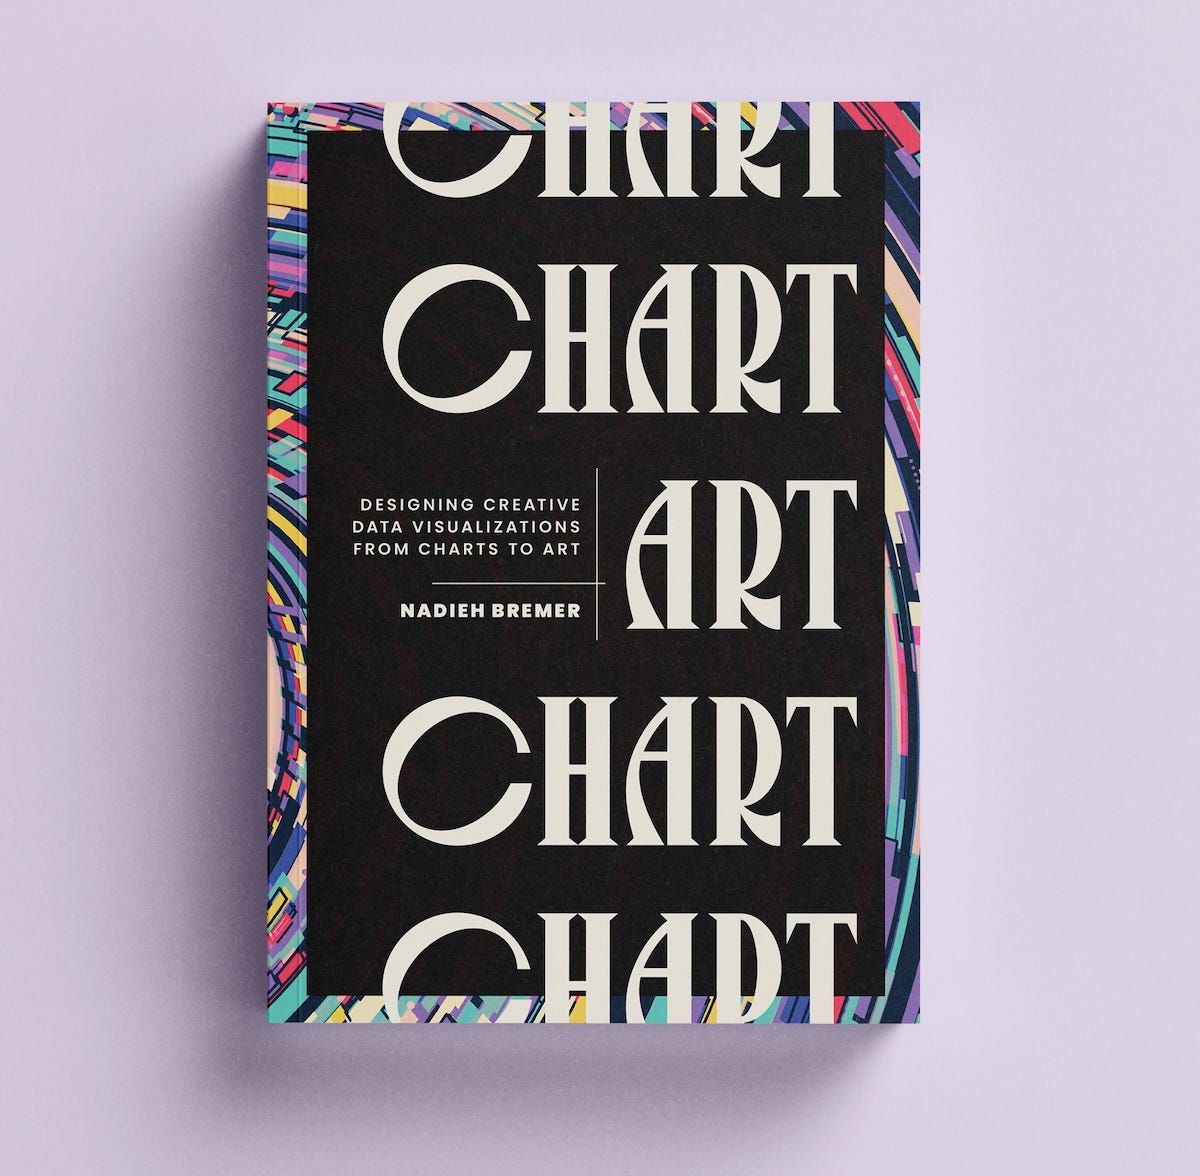
My new book CHART has been out for a few months now ✨ (thank you to those who shared their photos and thoughts online, the feedback has made the whole grueling process of writing a book all worth it!). I have a few small updates to share:
I’ve created a dedicated subpage on my website where you can find a link to an exclusive preview of the book (see the last section all the way down the page) in case you’d like to see what you’re getting if you’re still considering to get CHART.
Neil Richards wrote an extensive review about CHART where you can see more photos about all that appears on the book ^_^
I also had the pleasure to appear on the Storytelling with Data podcast talking more about the book, in case you prefer listening to reading.
See the CHART Site Here!
New Blog! | The Top Contributor Network
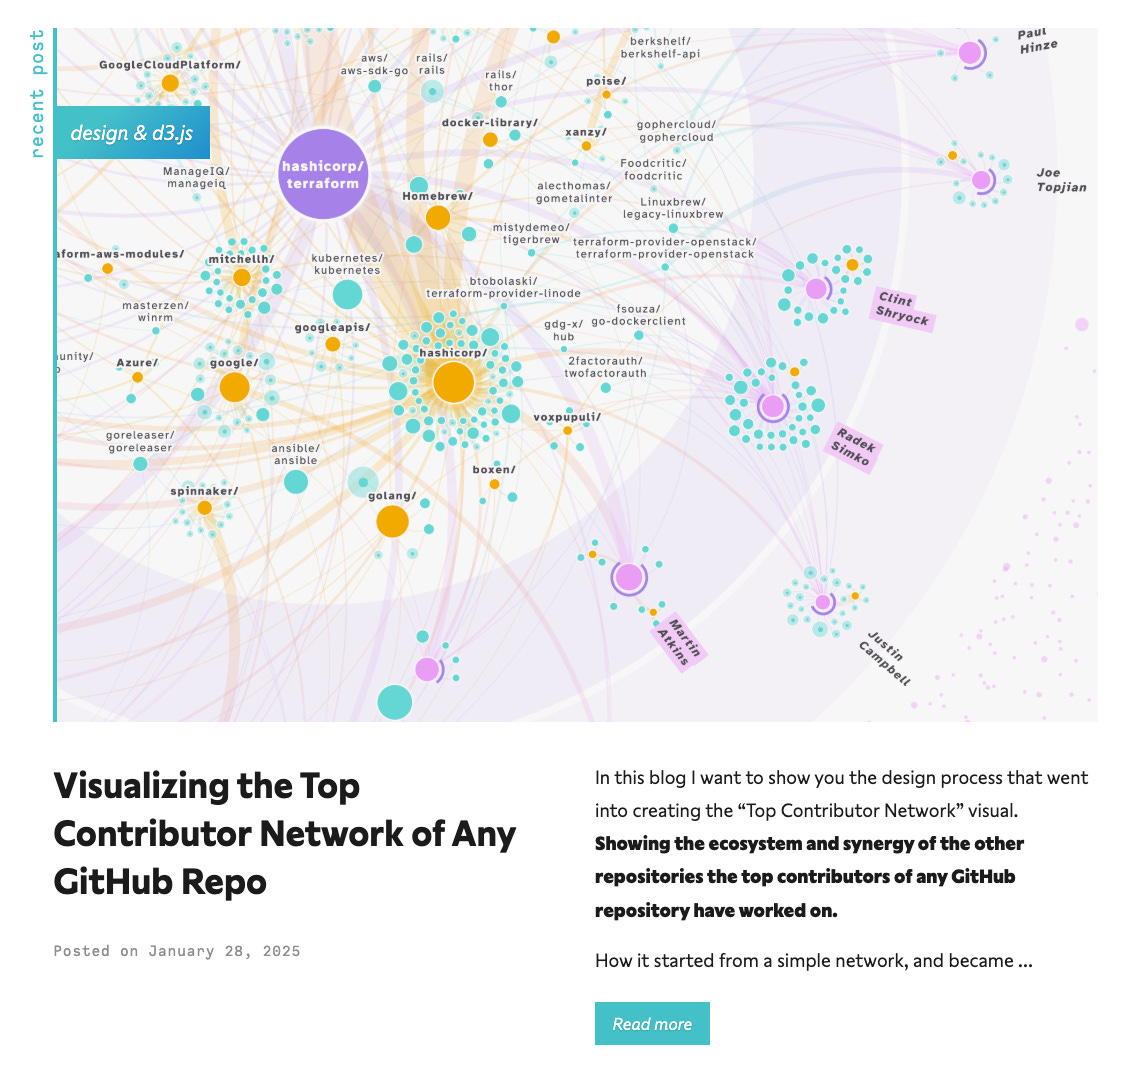
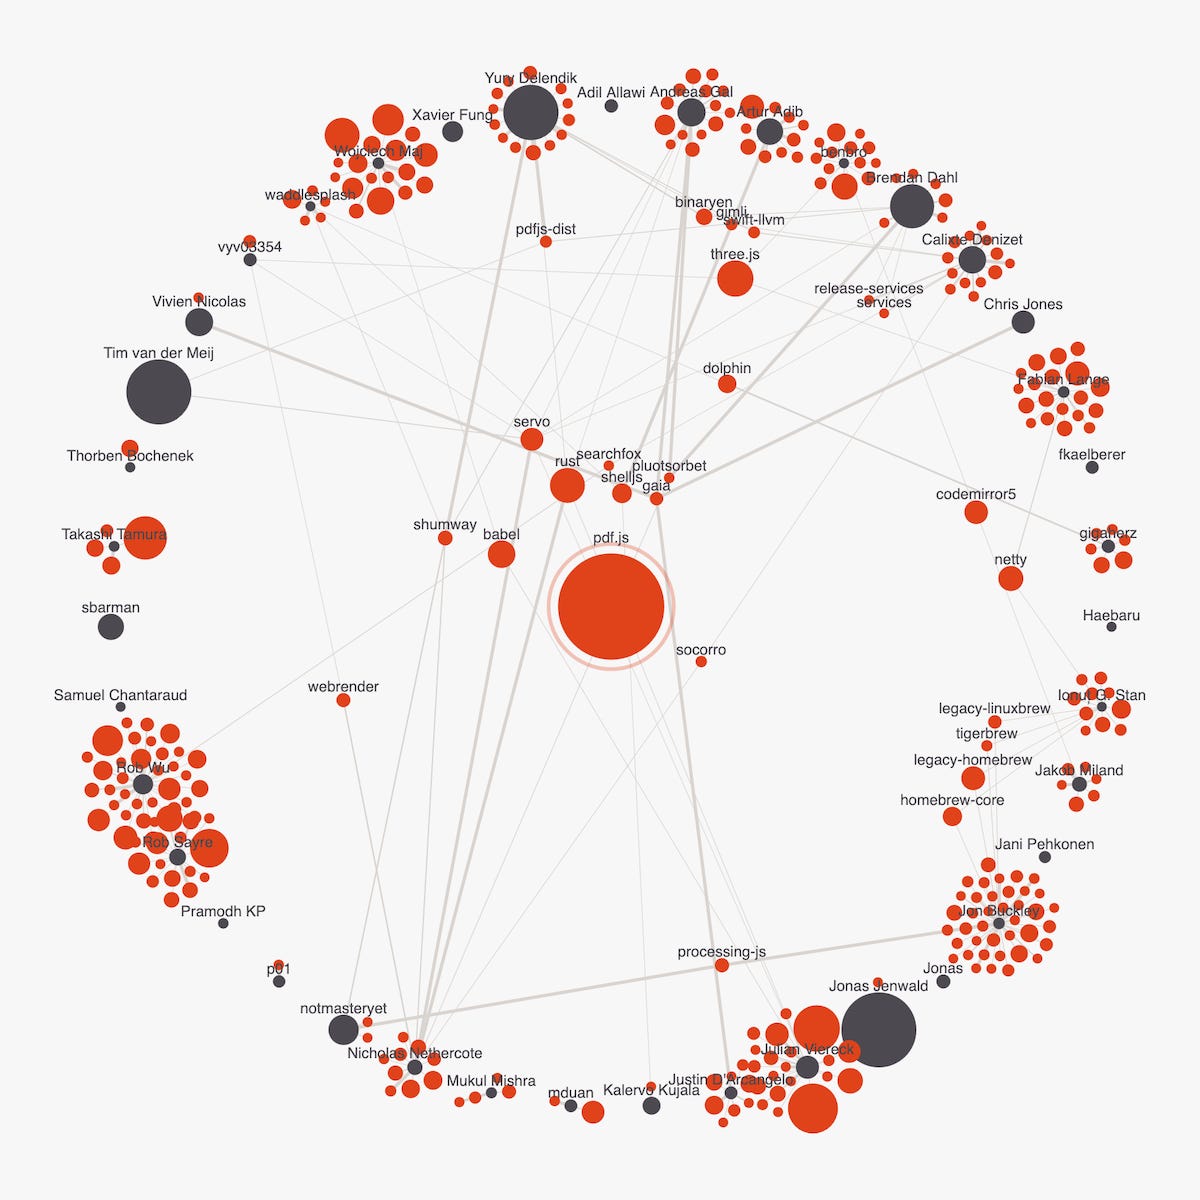
It’s been a while, but I finally wrote one of my extensive design blogs again! For this one I dive into the creation of the “Top Contributor Network” that I created for Mozilla. It goes all the way from the start and very first works in progress through all the ups and downs before ending up at the final design.
Read the Full Blog Here
That’s it again for now!
PS, the campaign for which I created the Methane Circle is up for a Shorty Award! In case you have some time, I’d highly appreciate if you could please give it a vote, thank you!
If you happen to get a copy of CHART, I’d love to see any photos or hear your thoughts! Feel free to tag me on LinkedIn, Bluesky, X, or instagram (or send me an email if you’d prefer)
Really glad about another of your Newsletters. Minor issue, the link to the “full blog version” is currently pointing to localhost - at least for me.