

Two Massive Projects released, featuring Birds and Tropical Diseases! Data Art and more...
Sharing my latest personal & client projects, art collections, blogs, and more

I spent most of my previous year working on two massive projects, both of which have finally released in the previous two weeks! One looks into Birds while the other reveals the work that we still need to do to end Neglected Tropical Diseases. But there’s also Data Art and an interview diving into my new book CHART!
Searching for Birds | Google Trends
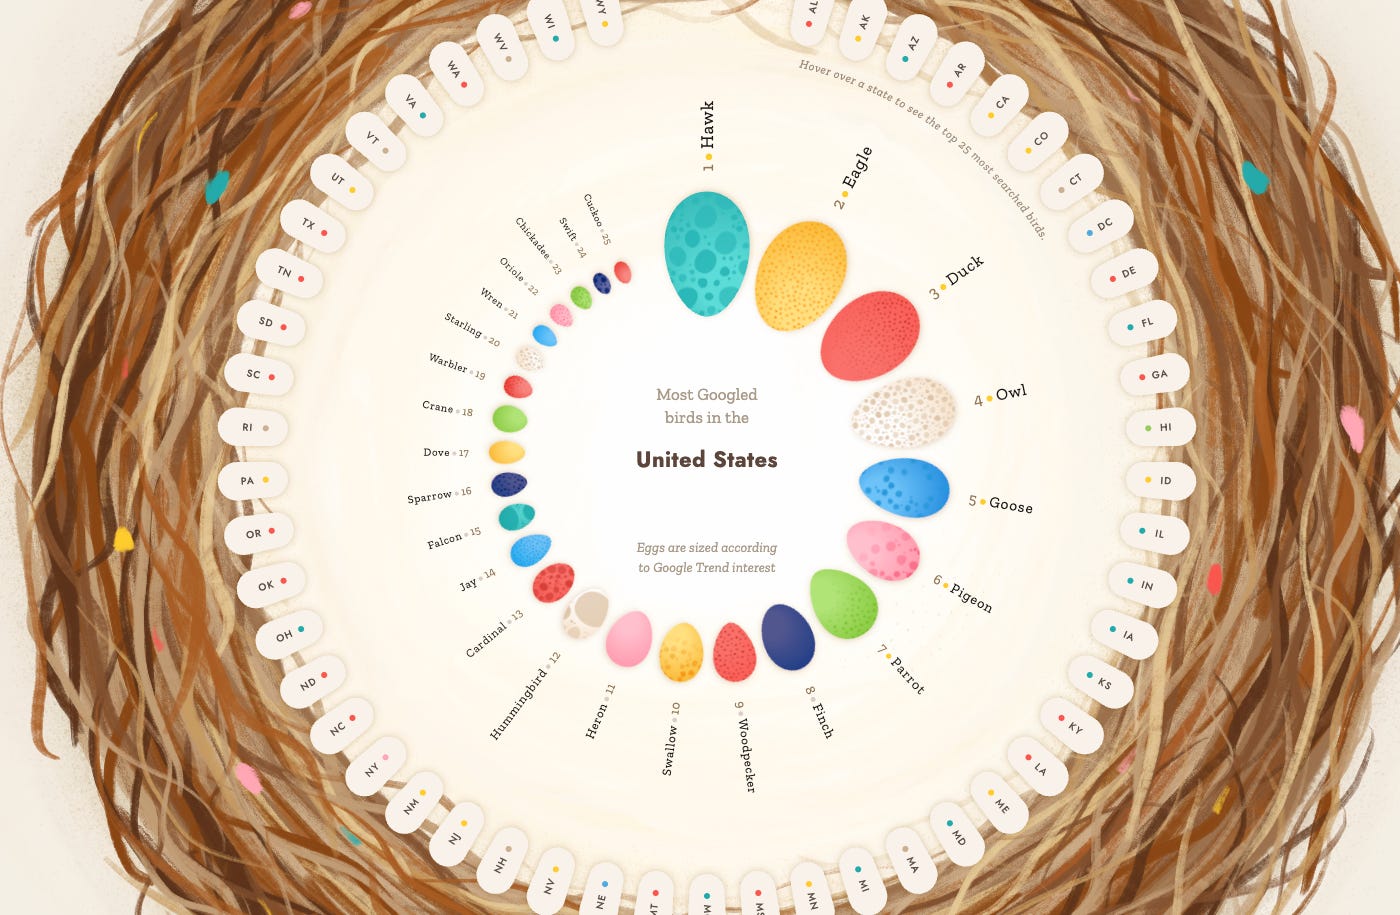
With the Global/Great Backyard Bird Count happening this weekend (join up, it’s fun!) the timing couldn’t be better for the release of my latest project. For several months I got to dive into the wide world of bird data, thanks to Google Trends, to finally emerge with an interactive exploration about how humans connect to birds by searching for them and identifying them.
I think this might be the biggest, and maybe even the most creative project I’ve ever worked on and I’m very proud of the result full of whimsical, highly custom and fun visualizations where you can get lost in exploring all that the data has to offer.
Check out “Searching for Birds” Here
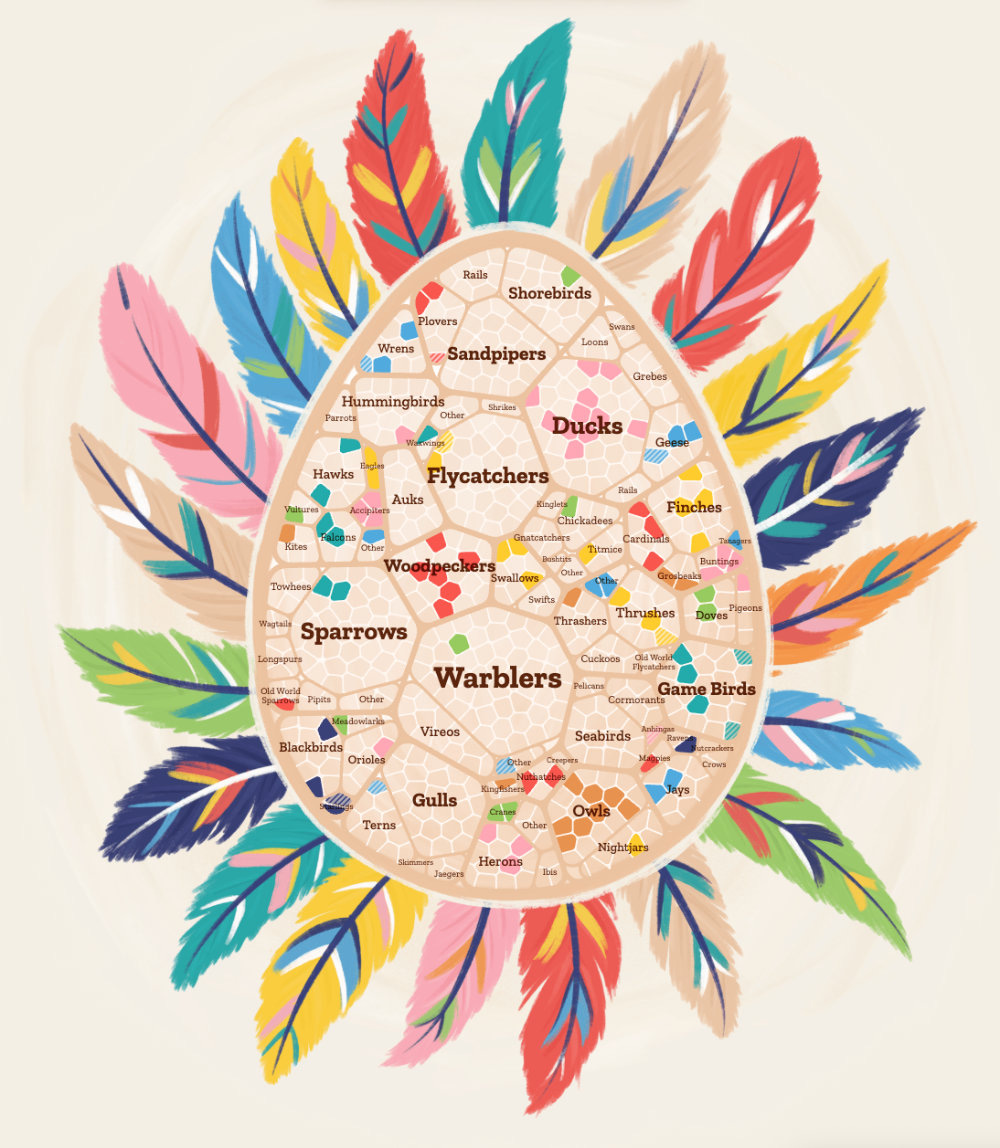
There’s a giant nest, a giant egg, a US map made of eggs, an ai bird identification helper, and more fun visuals to play with. I hope that, even if you’re not a bird person, you’ll enjoy casually learning more about the many flying fluffy feathery balls (and some are honestly too cute) we have in our world.
(As I’m self-publishing this, I would really really appreciate it if you would share it with others in case you found the story a fun read worth passing on 🙏 Thank you!)
A big thank you to Emily Barone who took my mountain of plots and initial thoughts for a story and scratched it all to come up with, and write a fantastic story tying all the most interesting results together.
Visualizing Neglect | The END Fund
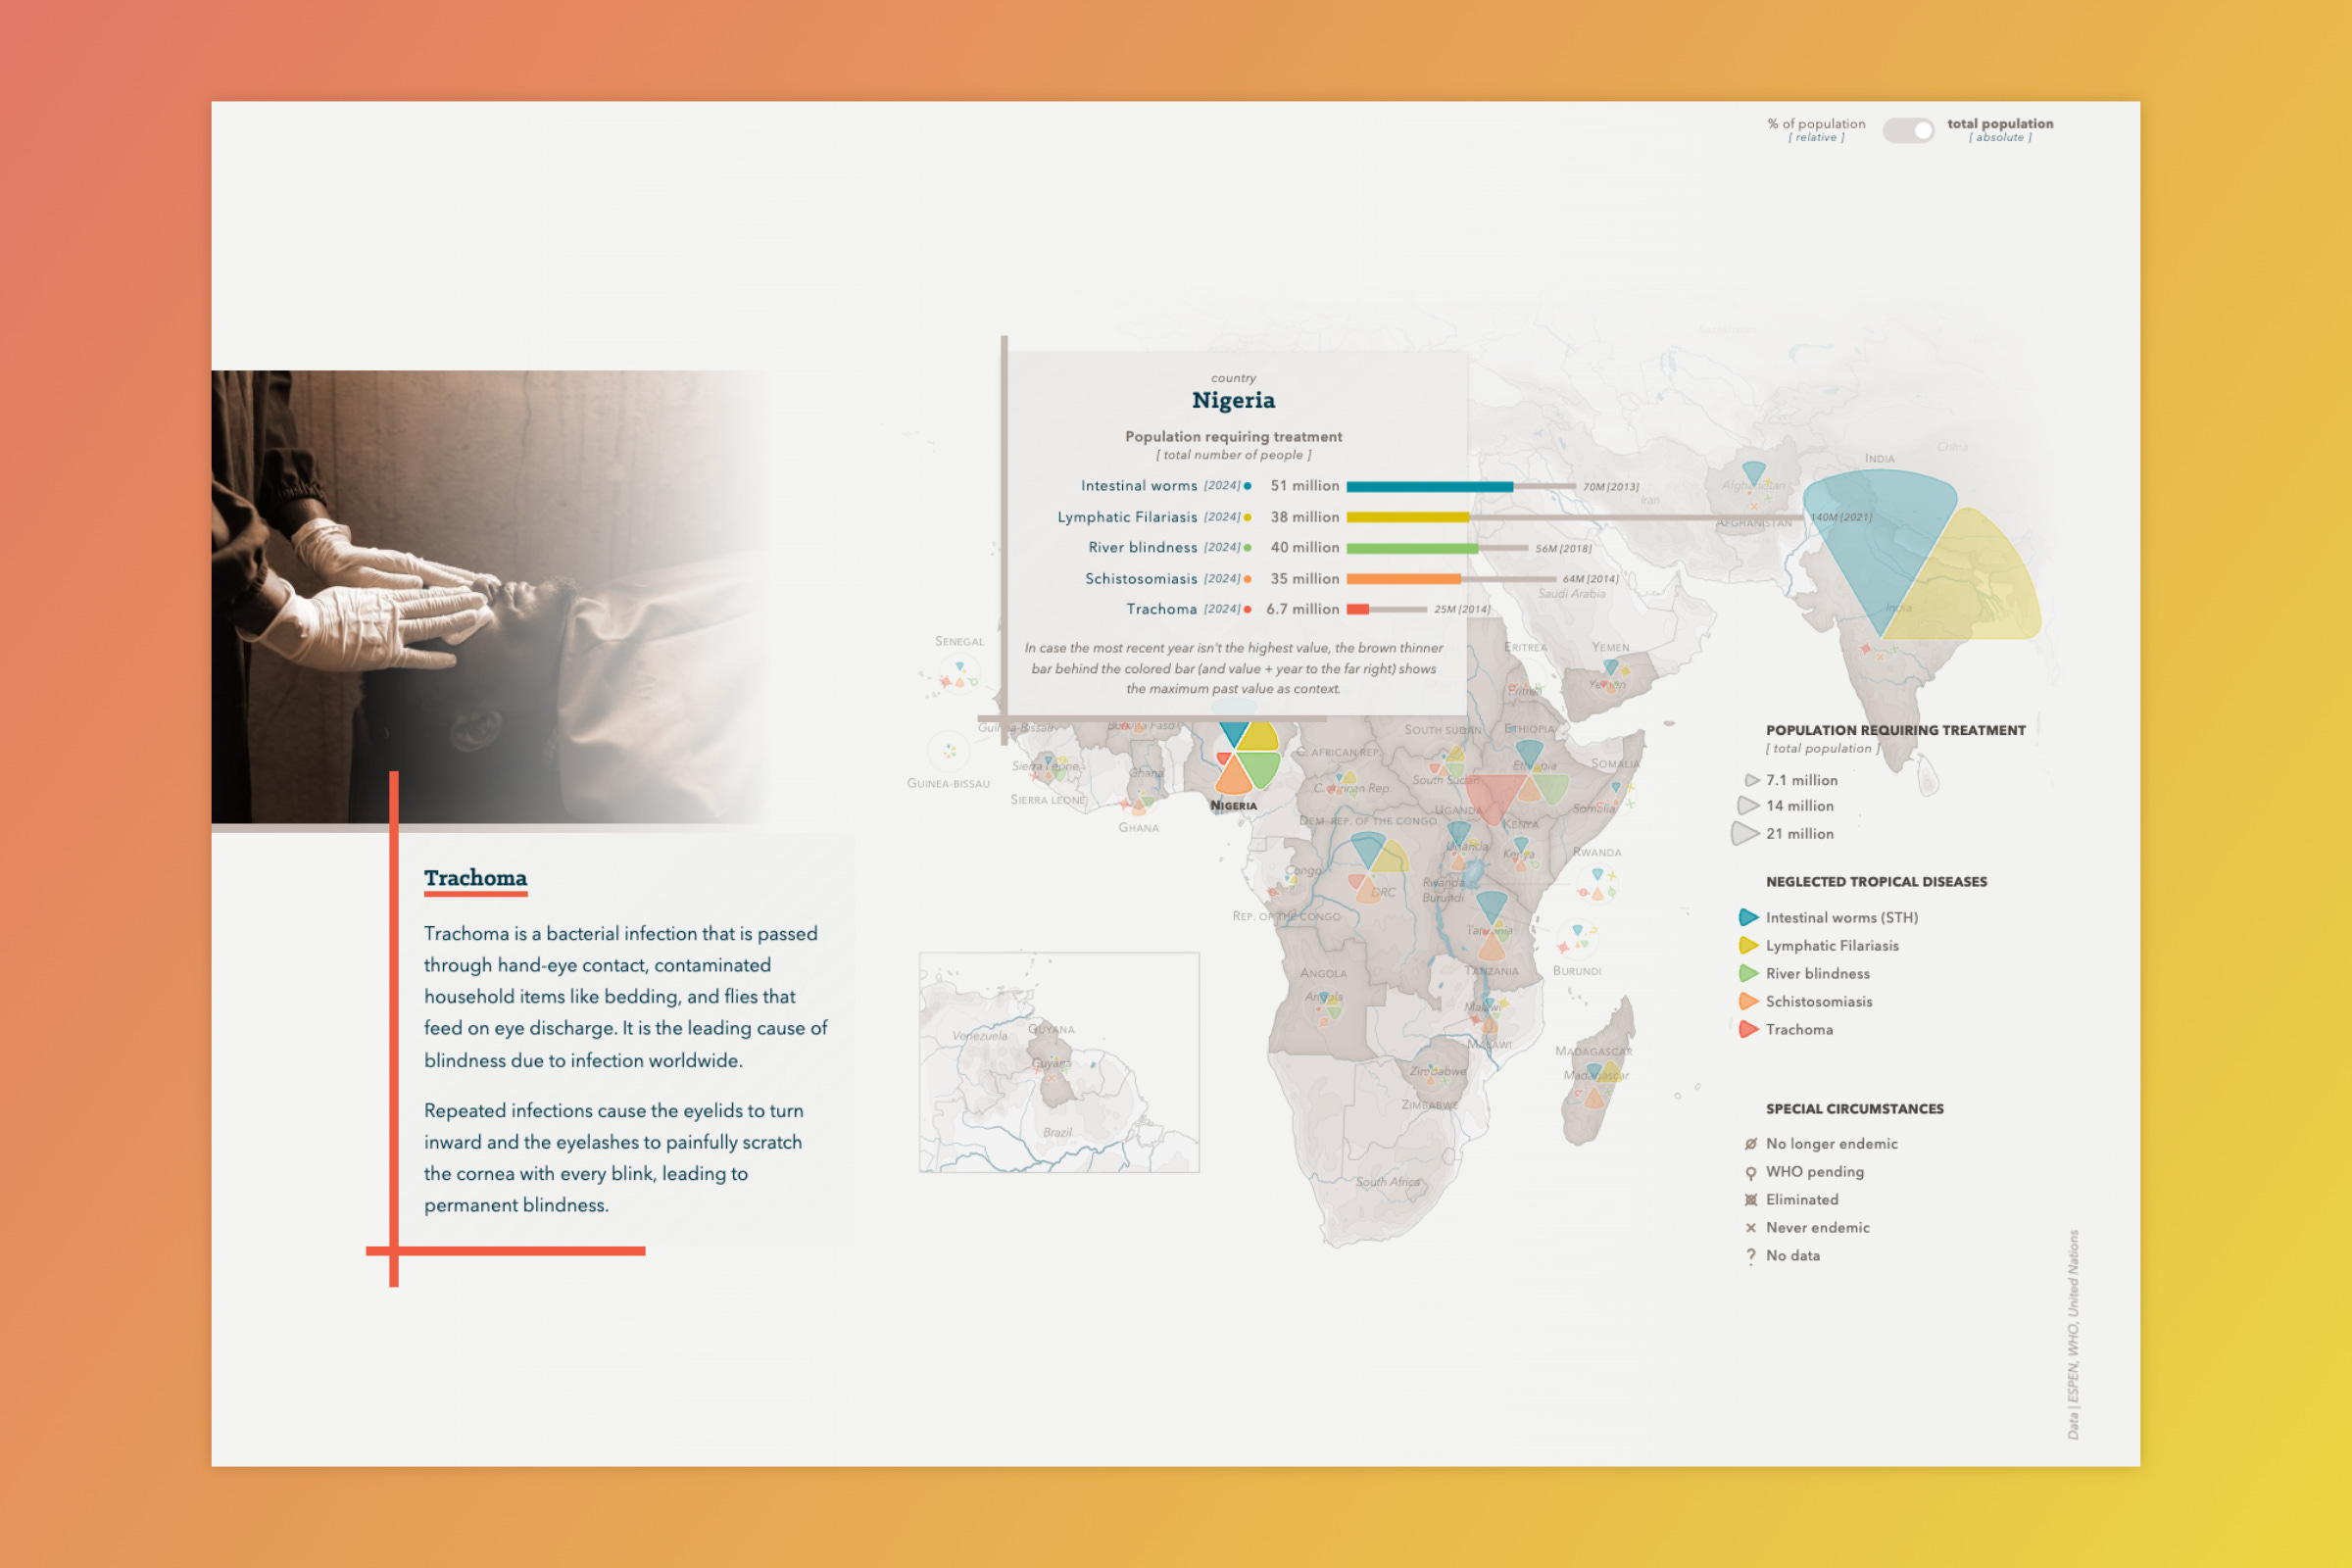
The second big project is a long-form, highly interactive data-driven article on “Neglected Tropical Diseases” that I created for The END Fund. It celebrates the quiet, historic progress made against neglected tropical diseases and spotlights why missing data tells a story of those most impacted by NTDs. Often women and marginalized groups, some of the most impoverished groups in the world, pay the price for this neglect.
It’s hard to capture this project in still images, there’s a map, glyphs in a grid, line charts, and an elaborate scrollytelling piece that introduces each of the six NTDs and their effect on people, while also showing the progress being made, and what still needs to be done to END them once and for all. I hope you’ll take the time to look at the result:
Explore “Visualizing Neglect” Here
Giant Wall-sized Data Artworks | DNV
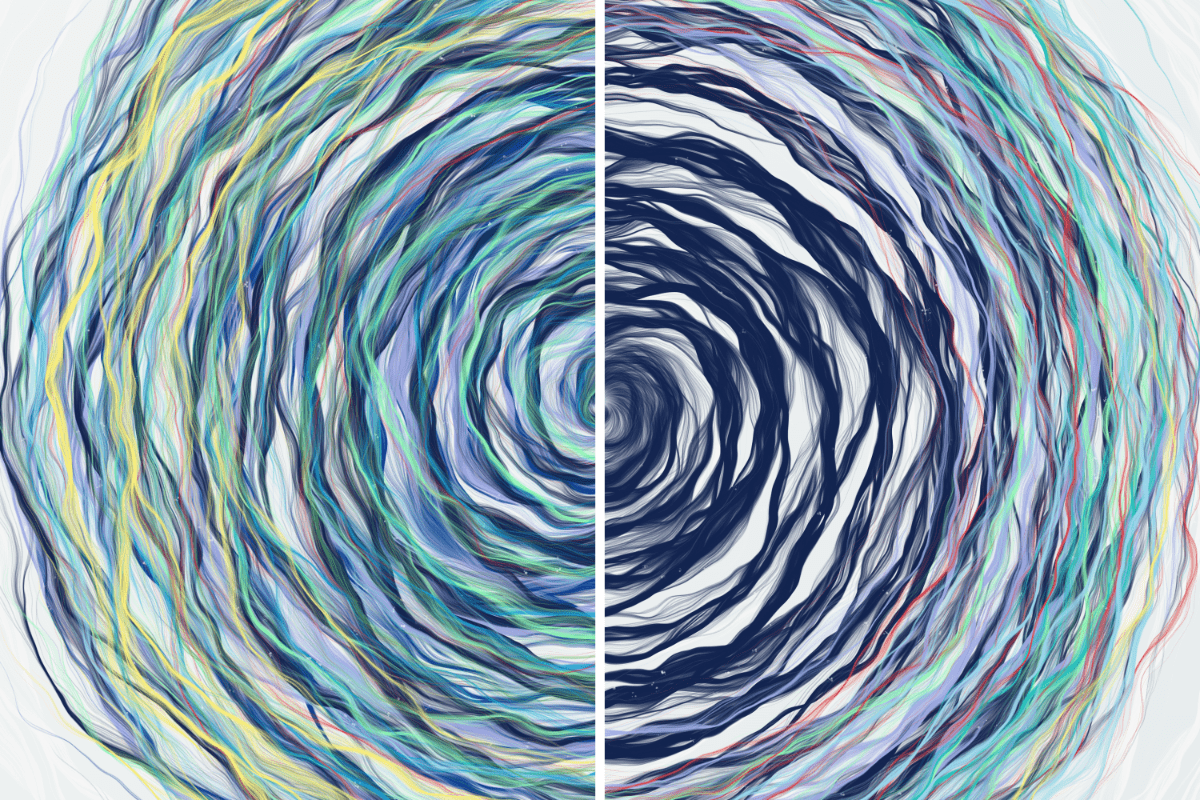
I’m very happy that I’ve been able to work on several data artworks over the past year! I sincerely hope that trend continues into this year 🤞 For this piece I created two data artworks that would span two walls of a new office space for DNV (~ 3 x 4 m).
I used data that they had recently published about the past and future energy transition, specifically for the marine sector (I developed several water-based concepts). You can see more of the artworks, concept sketches, and the explanation on how to “read” them with the link below.
See More of the Artworks Here
CHART Interview with Tamara and Alberto
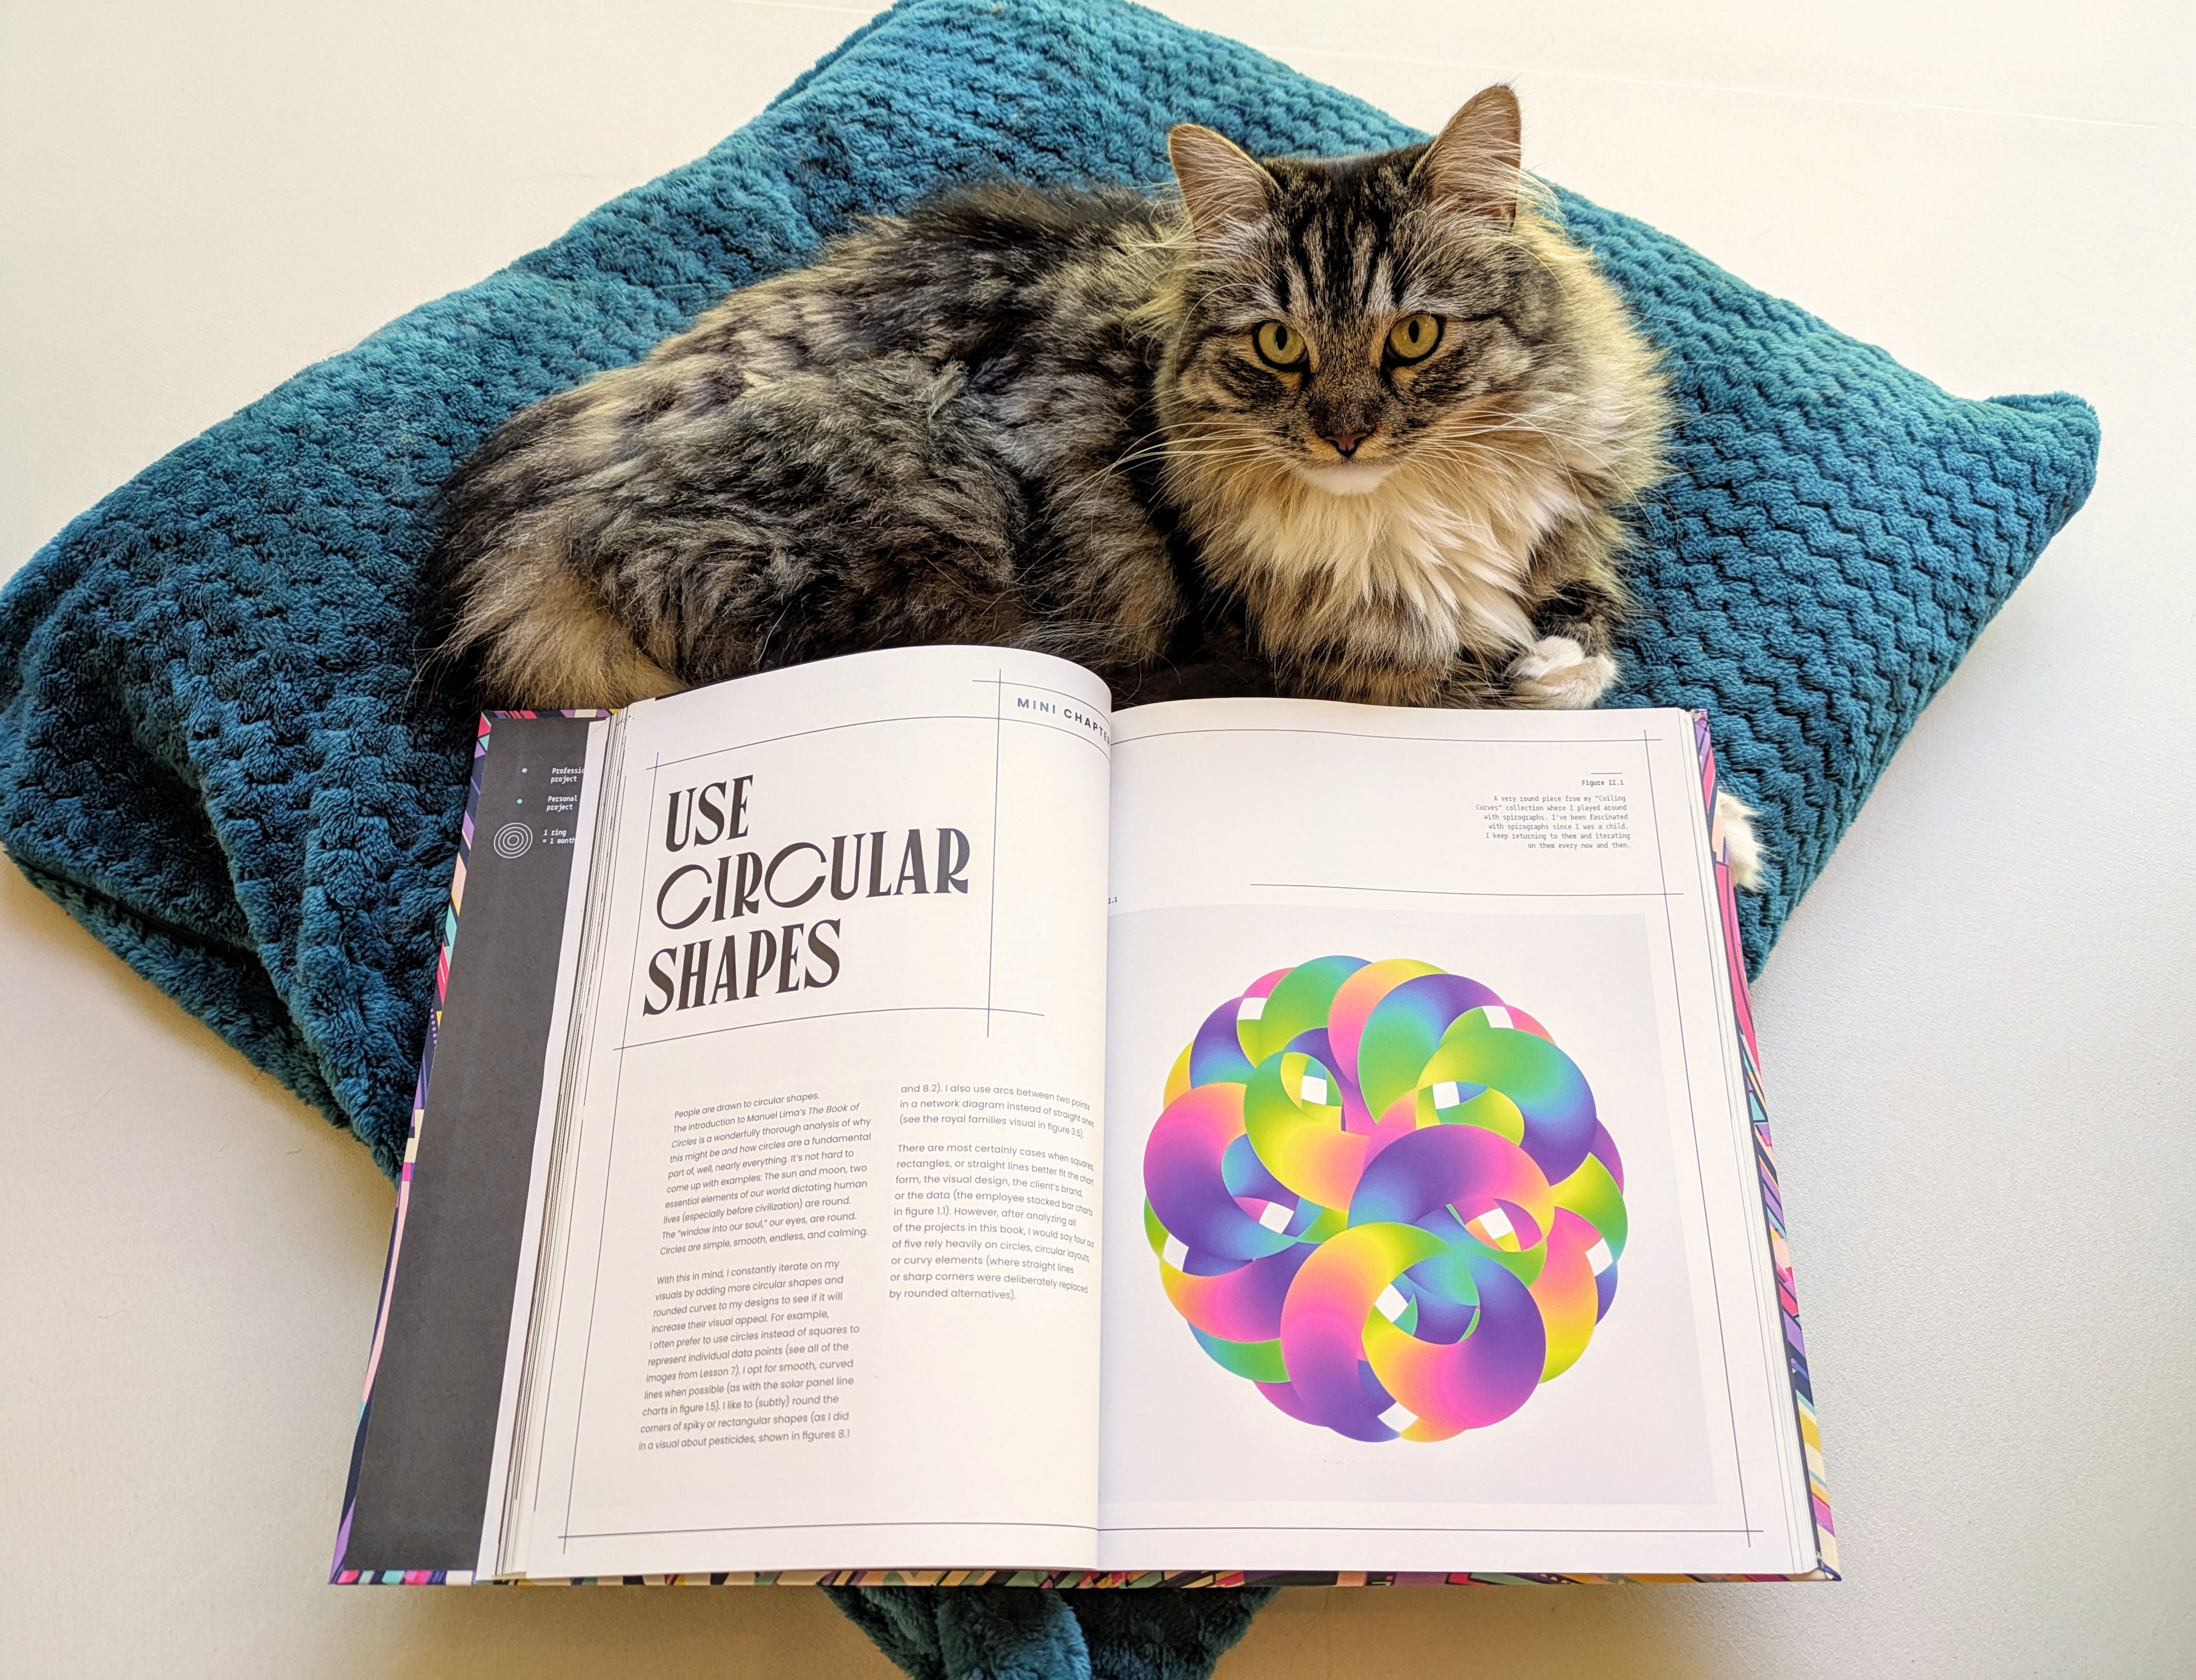
I got to (video) chat with Tamara Munzner and Alberto Cairo about my recent book CHART. We talk in-depth about ways to be more creative in the visualization of data; how to balance effectiveness with uniqueness, how to make an audience look at your chart and make it memorable. I also touch upon the design of the book, my influences and some easter eggs hidden throughout the book ^_^
See the Interview Here
That’s it again for now!
If you happen to get a copy of CHART, I’d love to see any photos or hear your thoughts! Feel free to tag me on LinkedIn, Bluesky, X, or instagram (or send me an email if you’d prefer)